
Introduction
With growth in renewable energy, much of the conversation has shifted away from the economics of energy production to energy storage. This is because many sources of renewable energy like solar and wind are variable and intermittent, affected by factors like changes in weather or time of day.
This reflects a lack of stability in power production, requiring the need for energy storage solutions to act as buffers or dispense energy in more controlled bursts. Such solutions are also useful in remote areas, where access to a grid to smooth out production is not available.
There are many such battery technologies, but I came across an interesting concept recently that really got me curious – water tank batteries. This article is my attempt to understand how to evaluate and calculate key metrics of such a battery setup. Also, it seemed fun :)
What is a Water Battery?
Water tank batteries are essentially water tanks that act as batteries. These work in a 3 stage process:
- Charge: pumping water into a storage tank at a higher elevation.
- Storage: storing that water until needed.
- Discharge: dispensing said water to a lower elevation to power a turbine.
The setup of a water battery can be visualised below:
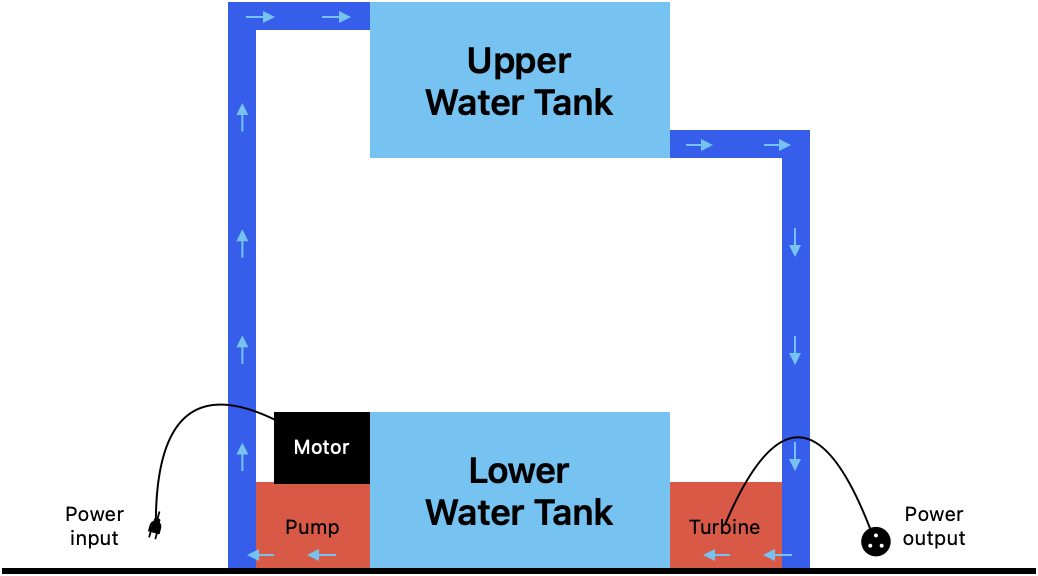
Energy is consumed by a motor to pump water up into the upper water tank (1). This water at height act as a medium to store energy as potential energy (2). Energy is then discharged by controlled dispensation from the upper water tank into the lower water tank through a turbine that generates electricity (3).
Interestingly, these are also (simplistically) the steps for pumped hydro energy storage systems, usually used for utility-scale electricity storage. These systems work by storing “energy in the form of potential energy of water that is pumped from a lower reservoir to a higher level reservoir”). There are two basic approaches to pumped hydro energy storage systems, the open-loop approach where the storage area is serviced by both natural inflows like rivers as well as the hydro pumps, and the closed-loop approach where projects are not continuously connected to any natural water inflows. In our article we will assume a closed-loop approach to reduce the variables we have to work with.
There are also varied differences in configuration as well, depending on the charging source. Some projects are connected to a main grid, and take advantage of off-peak electricity prices to pump water into the storage system, yet others are connected to variable but plentiful sources of renewable energy, with the hydro energy storage system acting as a buffer to smooth out energy generation. For the latter, it seems that even system efficiencies of just 40% are enough for such projects to make economic sense.
An example of a pumped hydro storage project that is both (a) open-loop and (b) relies on off-peak electricity is the Snowy 2.0 Pumped Storage Power Station project currently under construction, an extension to Snowy Mountains Hydro. In fact, I had the pleasure of seeing this one with my own eyes while touring the Snowys.
A Pumped hydro energy storage (PHES) system with Pico turbine
In terms of the turbine, there are 4 classes of hydropower turbines:
- Pico: less than 5kW
- Micro: 5kW to 100kW
- Small: 100kW to 1MW
- Large: over 1MW
In our case, we are interested in the Pico class of hydropower turbines, which are usually operated for domestic or off-grid use. This is also the size that, based on a scan of the literature, is most suited to the typical capacity of the water tanks we will be working with.
Therefore, we come to the interesting conclusion that a water tank battery is in essence a variant of a pumped hydro energy storage system, that uses a Pico turbine as a generator.
This understanding allows us to borrow equations from hydropower and dam energy storage.
Key Equations – Our Building Blocks
Before we continue, we need to develop a foundational understanding of our battery system. We can break this down into the 3 step process that we outlined above, and tackle understanding each step in turn.
Charge
When water is pumped up from the lower tank into the upper tank, we are essentially converting electrical power driving the moter, into potential energy stored up in the water at height. This allows us to contextualise our first key equation:
Charging Efficiency = Potential Energy Stored / Electrical Energy In
Here, we are concerned with the efficiency of our conversion process: How much potential energy do we end up with, for every unit of electrical energy we put in?
We can also look at this conversion of electrical energy in and potential energy stored as a chain of conversion steps:
Power source (electrical) –> Motor (kinetic torque) –> Pump (flow energy) –> Upper Water Tank (potential energy)
The above allows us to look at charging efficiency as a series of energy losses at each step of the conversion chain. In other words we can reformulate charging efficiency in terms of the cummulative efficiences of each step in the process, which is the product of the efficiences of each step.
Charging Efficiency = Motor Efficiency x Pump Efficiency x Infrastructure Efficiency
In our case, charging efficiency is the multiplication of the following factors
- the Motor Efficiency of converting electrical energy into kinetic torque energy
- the Pump Efficiency of converting kinetic torque energy into flow energy
- the Infrastructure Efficiency of combating parasitic losses due to factors like friction losses in the pipes
Storage
While water is being stored at height, it acts as a medium of gravitational potential energy, due to the gravitational attraction of the Earth trying to bring it down to a lower height. This energy can be harnessed by releasing the water to a lower height through a turbine (more on that later).
The equation that determines gravitational potential energy is as follows:
Potential Energy in J = Mass x Gravitational Acceleration x Height
Potential Energy in Wh = Mass x Gravitational Acceleration x Height / 3,600
where,
- Potential Energy is Gravitational Potential energy, measured in joules (J) but converted to watt-hours (Wh) with a division by 3,600
- Mass is the volume of the tank in litres, since water is roughly 1kg per litre
- Gravitational acceleration, is the acceleration of an object in freefall, which is usually a constant of 9.81 m/s²
- Height is the distance of the object from the ground
The fluid nature of water neccessarily complicates our height calculations. In addition, typical dam-based storage calculations require one to consider uneven terrain typical of lake beds which varies the center of gravity of the medium as the lake drains.
In our simplistic scenario however, we can control for this by enforcing a similar size and shape of the upper and lower water tanks, which allows us to use the middle of both tanks as the average center of gravity. This allows us to fix the center of gravity at the center of both water tanks, simplifying our height independent variable.
For brevity, our above equation is usually simplified into
P.E. in Wh = mgh / 3,600
where,
- P.E. in Wh is potential energy in watt-hours (Wh)
- m is mass in kilograms (kg)
- g is gravitational acceleration (m/s²)
- h is height in meters (m)
Because gravitational acceleration is a constant, we find importantly that the only 2 factors under our control are mass and height.
Note that unlike typical dam-based calculations, we can essentially assume negligible loss due to evaporation if our water tank is closed.
Discharge (Turbine)
When water is dispensed from the upper tank into the lower one, we convert potential energy back into electrical energy. In this context, we are interested in discharging efficiency:
Discharging Efficiency = Electrical Energy Out / Potential Energy Stored
In this case, we are interested in what percentage of electrical energy we can extract from the stored potential energy in our water tank.
A fun fact and short digression: Fossil fuel power plants usually measure power plant efficiency in terms of the Heat Rate, which is the “percentage of total energy content of a power plant’s fuel converted into electricity.” In short, Heat Rate = Thermal energy in / Electrical Energy out. But this is different from the way we look at efficiency in this article, because the Heat Rate is actually the inverse of our discharging efficiency.
Back to our topic on hand.
Like in the charging step, we can look at discharging efficiency in terms of its chain of processes:
Upper Water Tank (potential and flow energy) –> Turbine (electrical energy) –> Lower Water Tank (depleted)
We can hence formulate discharging efficiency as:
Discharging Efficiency = Turbine Efficiency x Infrastructure Efficiency
As such, discharging efficiency is the multiplication of the following factors
- the Turbine Efficiency of converting potential and flow (through the pipes) energy into electrical energy
- the Infrastructure Efficiency of combating parasitic losses due to factors like friction losses in the pipes.
Key Metrics
With our key equations established, we can derive some important battery metrics for our water tank battery: Battery Capacity, Battery Efficiency, Energy Density and Power Density.
Battery capacity parameters
Battery capacity represents the maximum amount of energy that can be extracted from a battery at full charge. In hydro power, this represents the number of watt-hours that can be generated by releasing water in a reservoir at full capacity. This means that we have to also consider discharging efficiency, which will reduce the amount of energy available at the point of discharge after conversion.
Deriving an equation
Based on the above, we can deduce from our key equations that
Battery Capacity = P.E. in Wh x Discharging Efficiency
Battery Capacity = mgh / 3,600 x Turbine Efficiency x Infrastructure Efficiency
This equation reflects that battery capacity is the amount of potential energy available in storage, reduced by turbine and parasitic energy losses.
Note that though ampere-hours (Ah) is used by many providers, we use watt-hours (Wh) instead, which is a universal unit that allows direct comparison between batteries by zeroing out Voltage (V) and Amperes (A) considerations.
Let’s contextualise our equation with a numerically driven scenario.
Scenario: Rural Single Family Home Water Tank capacity
We can apply our equation to determine the amount of battery capacity a typical single family home water storage tank can hold, if we turn it into a water tank battery. This should give us an idea about the sense of scale. Let’s gather data for our necessary variables.
- Turbine efficiency
To a certain extent, some of the water tank specifications depend on the choice of turbine we choose to implement in our system. So let’s begin by examining turbine efficiency.
Though hydroelectric power plants generally have very high energy efficiencies upwards of 90%, pico hydro systems have much lower efficiences. Efficiencies depend not only on turbine type, but are also directly related to flow rate and height (technical term: water head), which are themselves interrelated. Usually, the higher the flow rate and water head, the higher the turbine efficiency.
Several studies provide a sample of numbers we can work with. One study highlights efficiencies ranging from as low as 20% to a maximum of 45%. Another study explores the use of a traditional water wheel for low water head situations, finding that water heads from 1-3 meters allow efficiencies of around 15.75%, based on a combination of efficiencies of the water wheel, mechanical parts involved and loss from the turbine. A computer modelling-based study finds that 2 meter water heads can provide efficiencies ranging from 8% up to 45%, increasing with flow rate ranging from 5.6 to 12.9 L/s.
The range of values is huge, but the first study alone gives us some estimates to work with. The two we can use are
- Efficiency of 20%, with a flow rate of 4 L/s and water head of 5.5m
- Efficiency of 45%, with a flow rate 28 L/s and water head of 18m
When working with batteries, efficiencies matter, so let’s use the 45% efficiency.
- Infrastructure efficiency
Parasitic losses in the infrastructure are likely not going to be significant enough to warrant a full study, unless we use really long and elaborate piping setups. But given the significant losses we already have to deal with in other parts of the system, this seems like a poor way to spend our time. For the sake of exercise, let’s assume something borderline negligible and use a value of 96%.
- Mass
According to a study by Penn State, rainwater cisterns that capture rainwater for household use base estimates of cistern sizes on two factors: annual domestic water needs, and buffer supply in months.
On the conservative end of the estimates, common household planning places water use at 75 gallons a day per person. We translate this into 416,000 litres per year for a family of four, because only barbarians use gallons. Just kidding, litres just fit our equations better.
In terms of buffer supply, it is recommended for the state used in the study (Pennsylvania), that 3 months of supply is a good buffer for the dry season. Naturally this varies depending on a household’s location, but we’ll use 3 months for simplicity’s sake.
This suggests that our water tanks would be roughly 100,000 litres in size. And therefore the mass of our water at full capacity would be 100,000 kg, given fresh (rain) water’s density of approximately 1000 kg/m³.
- Height
As mentioned earlier in the section on turbine efficiency, height actually has a technical term in the context of hydropower – water head. For our scenario, we can hence substitute height for the corresponding water head value of our chosen turbine configuration, which currently stands at 18 meters.
Now that we have our variable values, let’s go ahead and plug these values into our battery capacity equation.
Battery Capacity = mgh / 3,600 x Turbine Efficiency x Infrastructure Efficiency
Battery Capacity = 100,000 x 9.81 x 18 / 3,600 x 45% x 96%
Battery Capacity = 2,120 Wh
This water tank configuration hence provides a battery capacity of 2,120 Wh, or 2.12 kWh. The average household electricity consumption in Pennsylvania stands at 10,402 kWh per annum, which translates to almost 28.5 kWh per day. A full charge of this water tank battery will just barely keep a household going for 28.5 / 2.12 = 2 hours a day.
Phrased another way, to keep a household in Pennsylvania going for a whole day on water tank batteries, almost 14 water tank batteries of this configuration have to be built.
In contrast, the typical lead-acid battery that a Mazda 3 would use (insert honorable mention of my first car) is a 12V-60Ah battery. However, lead-acid batteries can only be safely discharged to 50%, any lower and they face permanent damage. This places the effective lead-acid battery capacity at 12V x 60Ah x 50% = 360 Wh. To sustain a full day of use, 28,500 Wh / 360 Wh = 79 Mazda 3 lead-acid batteries would have to be employed.
Battery efficiency
Battery efficiency looks at how much energy you put into the battery, versus how much energy you take out, vis-à-vis a battery’s charge-discharge cycle. The higher the efficiency, the more energy is recovered at the end of the cycle.
Simplistically, unless there is a leak, we can assume minimal efficiency losses during storage in a covered tank. Therefore we can infer battery efficiency to be the product of charging efficiency and discharging efficiency.
Deriving an equation
The above can be described using the following equation:
Battery Efficiency = Charging Efficiency x Discharging Efficiency
Battery Efficiency = Motor Efficiency x Pump Efficiency x Infrastructure Efficiency (Charging) x Turbine Efficiency x Infrastructure Efficiency (Generating)
Where battery efficiency is simply the product of all the efficiencies we have examined so far.
Plugging in some numbers
We have already examined the efficiencies of some Pico turbines, with numbers ranging from 8% to 45% in various studies examined. We also applied a value of 96% in our previous scenario to reflect a belief that infrastructure efficiencies are borderline negligible in our small setup; we can reuse that assumption again.
This leaves us with a need to identify motor and pump efficiencies that we can work with in our small scale setup. For this we can turn again to several studies on the topic. In this study that examines photovoltaic driven pumping systems using switched reluctance motor drives, motor and pump efficiences are identified to be 85% and 56.3% respectively. This represents a combined 47.9% efficiency.
This total efficiency tracks with the 30-50% range of efficiency of a brushless DC motor and helical pump combination outlined in another study on renewable energy water pumping systems. However, a third study on solar water-pumping places efficiencies lower at 12-30%.
Let’s do 2 runs, an optimistic run taking the best efficiencies, and a pessimistic one taking the worst efficiencies, just to see how both look.
- In the optimistic run, we use the motor-pump efficiency of 50%, and turbine efficiency of 45%.
Battery Efficiency = Motor Efficiency x Pump Efficiency x Infrastructure Efficiency (Charging) x Turbine Efficiency x Infrastructure Efficiency (Generating)
Battery Efficiency = 50% x 96% x 45% x 96%
Battery Efficiency = 20.7%
- In the pessimistic run, we use the motor-pump efficiency of 12%, and turbine efficiency of 8%.
Battery Efficiency = Motor Efficiency x Pump Efficiency x Infrastructure Efficiency (Charging) x Turbine Efficiency x Infrastructure Efficiency (Generating)
Battery Efficiency = 12% x 96% x 8% x 96%
Battery Efficiency = 0.9%
This gives us a range of battery efficiencies between a horrific 0.9%, to a probably not any better 20.7%.
In comparison, larger scale systems generally sport much better system efficiencies. For example, a pumped hydro energy storage review for a possible Jordanian project places estimated efficiencies at 78.1%. Another study that examined several projects in operation placed efficiences from a range of 70-80%.
Not all is lost?
In spite of these numbers, it might be possible to justify the use of water tank batteries in certain contexts.
For example, some energy bases high in variability like solar or wind might justify this efficiency loss, if only excess energy that would have been wasted anyway is used to power pumps. An often cited example is that of the greek remote village in Donoussa Island, which uses excess solar PV power in the day to power a pump. This pump acts in reverse as a turbine at night to consume the potential energy stored.
Another possible approach considered was to rely on a differential between off-peak and peak pricing – as long as the value of the difference beats the efficiency losses, profit could theoretically be made.
Energy Density
Energy density measures how much energy can be stored per volume by a battery. This is simply the battery capacity of the system divided by its total volume.
Deriving an equation
The above can be characterised by the following equation:
Energy Density = Battery Capacity / Volume of Setup
where,
- Energy Density is measured in watt-hours per litre (Wh/L)
- Battery Capacity is measured in watt-hours (Wh)
- Volume is measured in litres (L)
Borrowing our earlier scenario
Let’s borrow our our single family home water tank battery scenario, and try to calculate the energy density of that setup.
We already have the battery capacity from that scenario: 2.12 kWh, which translates into 2,120 Wh. So all we need to do is derive the volume of our setup.
Simplistically, we identify that the motor, pump and turbine likely take up a relatively small percentage of the entire setup, and hence can be disregarded. That leaves two water tanks to account for, the volumes of which we already know from our earlier calculations: 2 tanks of 100,000 litres each.
We can simply plug these values into our equation:
Energy Density = Battery Capacity / Volume of Setup
Energy Density = 2,120 Wh / (2 tanks x 100,000 L)
Energy Density = 0.0106 Wh/L
In comparison, lead-acid batteries have energy densities of 80-90 Wh/L. That means that even at the lower end of lead-acid battery energy densities (80 Wh/L), lead-acid batteries are 7,500 times more energy dense than our water battery setup. In other words, lead-acid batteries require 7,500 times less space than our water tank battery setup to operate.
Power Density
Power density is a measure of power output per unit volume. It is not as frequently used a measure as energy density, but could still provide interesting insights.
Deriving an equation
In general, resources on the web define power density with the equation
Power Density = Power Output / Volume
Which seems intuitive enough, except that problem with this definition is that it begs the question: Volume of what? To answer this, I borrow the definition from this article that defines volume in terms of the volume of the power source, which in our case is the volume of our setup. This is the 2 water tanks calculated previously.
Power Density = Power Output / Volume of Setup
where,
Power Density is measured in watts per cubic meter (W/m³)
Power Output is measured in watts (W)
Volume of Setup is measured in cubic meter (m³)
The equation to derive power output from a hydro generator is as follows
Power Output = Flow Rate x Water Head x Specific weight of water x Effiency of system
Power Output = Flow Rate x Water Head x Specific weight of water x Discharge Efficiency x Infrastructure Efficiency
Power Density = (Flow Rate x Water Head x Specific weight of water x Discharge Efficiency x Infrastructure Efficiency) / Volume of Setup
where,
- Flow Rate is usually measured in L/s in our article, but here we measure it m³/s to simplify the equation
- Water Head is measured in meters
- Specific Weight of Water is a constant of 9,810 N/m³
Borrowing our earlier scenario again
Let’s evaluate the power density of our single family home water tank battery. Interestingly, all of the values we need have already been figured out:
- Flow Rate: Flow rate of our chosen turbine at 28 L/s, which is equivalent to 0.028 m³/s
- Effective head in meters: 18m
- Discharge Efficiency: 45%
- Infrastructure Efficiency: 96%
- Volume of Setup: 2 x 100,000 L
Plugging this into our equations:
Power Density = Power Output / Volume of Setup
Power Density = (Flow Rate x Water Head x Specific weight of water x Discharge Efficiency x Infrastructure Efficiency) / Volume of Setup
Power Density = (0.028 x 18 x 9810 x 45% x 96%) / Volume of Setup
Power Density = (2,136) / (2 x 100,000)
Power Density = 0.01068 W/L
We arrive at a Power Density of 0.01068 W/L.
Scaling power density
Let’s take a second look at the completely unfurled equation:
Power Density = (Flow Rate x Water Head x Specific weight of water x Discharge Efficiency x Infrastructure Efficiency) / Volume of Setup
Notice how we can increase the power density of our water tank battery by basically increasing the flow rate? In the case of hydropower, a practical way to scale power density can be done by increasing the number of connected turbines, or adding to the height of the water head.
We can also reduce the volume of the setup, but that doesn’t seem to make much sense to me – the power density factor in this case would seem to just be a pointless measure.
Bonus: Discharge Duration
Something I got curious about along the way: How long would a water tank battery last? This is surprisingly easy to deduce, since we don’t need to resort to any complicated fiddling with electrical equations. Instead, our setup already provides a mean flow rate and the size of the tank, which allows us to use a very simple fluid dynamics equation.
The equation
The equation would look like this:
Discharge Duration = Volume of Water Tank / Flow Rate
where,
- Discharge Duration is how long it will take for the water tank battery to fully discharge in seconds (s)
- Volume of Water Tank is in litres (L)
- Flow rate is in litres per second (L/s)
Plugging in the numbers
Again, borrowing from our single family home example, we simply have to plug in numbers we already know: 100,000 L for the water tank volume, and 28 L/s for the flow rate.
Discharge Duration = Volume of Water Tank / Flow Rate
Discharge Duration = 100,000 / 28
Discharge Duration = 3,571 seconds
Discharge Duration = 1 hour
Each of our water tanks would last 1 hour discharging at full power.
Conclusion
In this article, we have sought to understand the fundamentals that drive a water tank battery’s key parameters. We have looked at the key battery metrics of capacity, efficiency, energy density and power density, and a bonus metric of discharge duration, and identified ways to derive them. We have also run some scenarios for contextualisation, and examine the practicability of implementing such a system in our own backyards.