
This post is part of a 3 part series that uses a spreadsheet to answer the following question: can you retire? The 3 parts are as follows:
Introduction
Welcome to Part 2 of the series Can I retire? In this part we will expand on the original post, and tackle with much more detail the expenses section of your spreadsheet.
First we will examine the why for this part. After that we will take some time to get a more accurate picture of your expenses. Then we will look at a strategy we can use to optimise it.
To follow along, you can use the following spreadsheet:
Alternatively, you can download one of the prepared spreadsheets below:
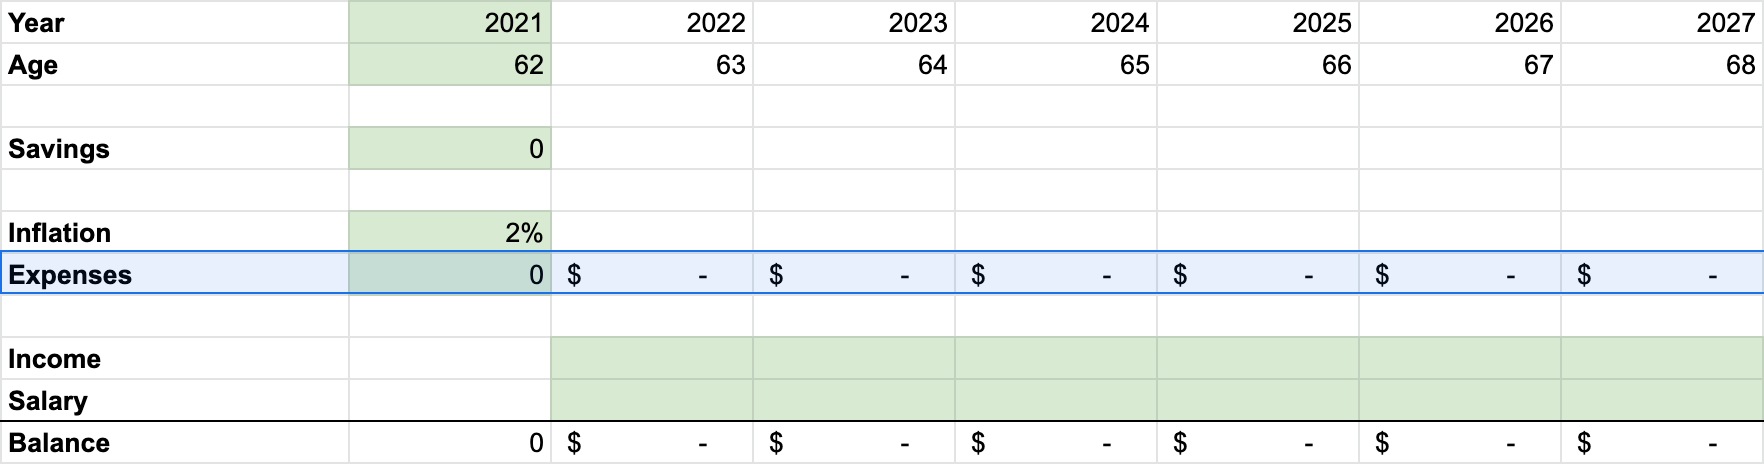
Notice how most of the fields are similar to the one from Part 1, except that now expenses consists of a breakdown of items.
Quick disclaimer: Please treat the information in this article as only one of the many sources you can use, and do your own further research in order to make an informed decision.
How should I use this section?
The important thing about this section is that it is probably not meant to be used as part of a long-term plan. The tactic we employ here involves trying to shrink our expenses in a very targeted way. Shrinking expenses always involves making sacrifices – and sacrifices are hard. The harder the sacrifice the shorter we will want it to be.
With that in mind, the tactic outlined in this strategy is most useful in a situation where you perhaps notice just a slight shortfall in your budget. Perhaps you notice that with your projections in part 1 you could retire in 2-3 years, except for a short dip in your budget before a quick recovery.
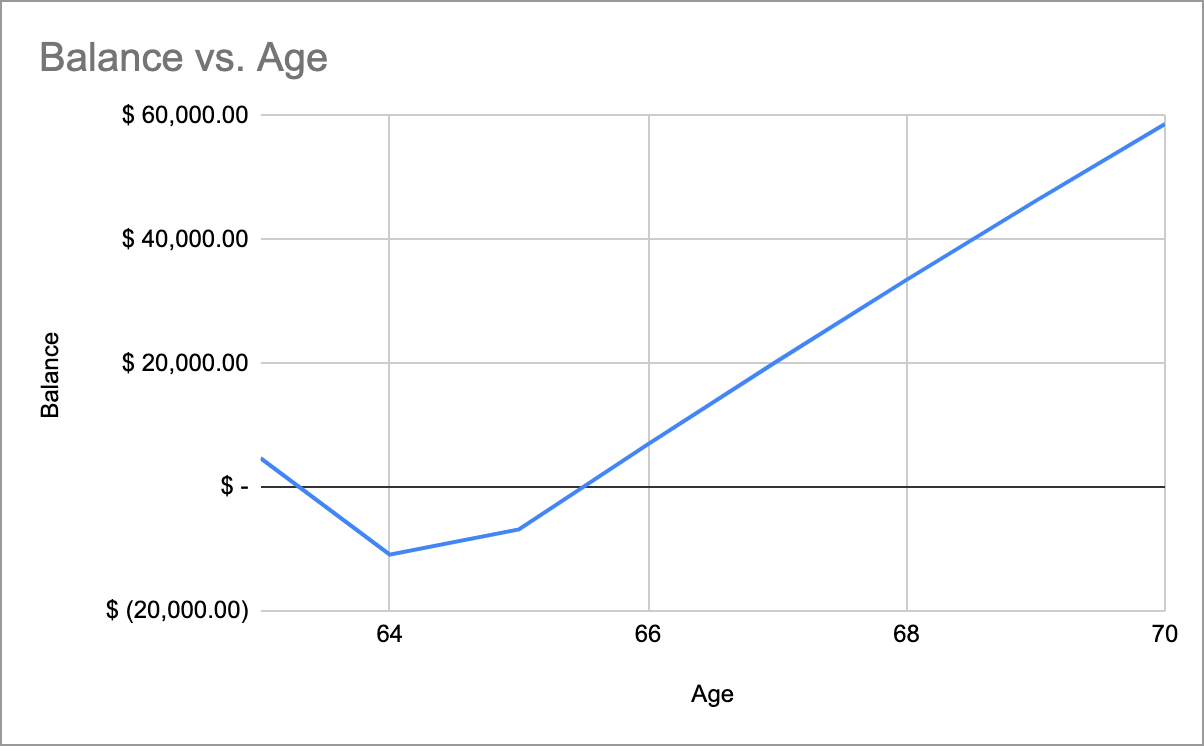
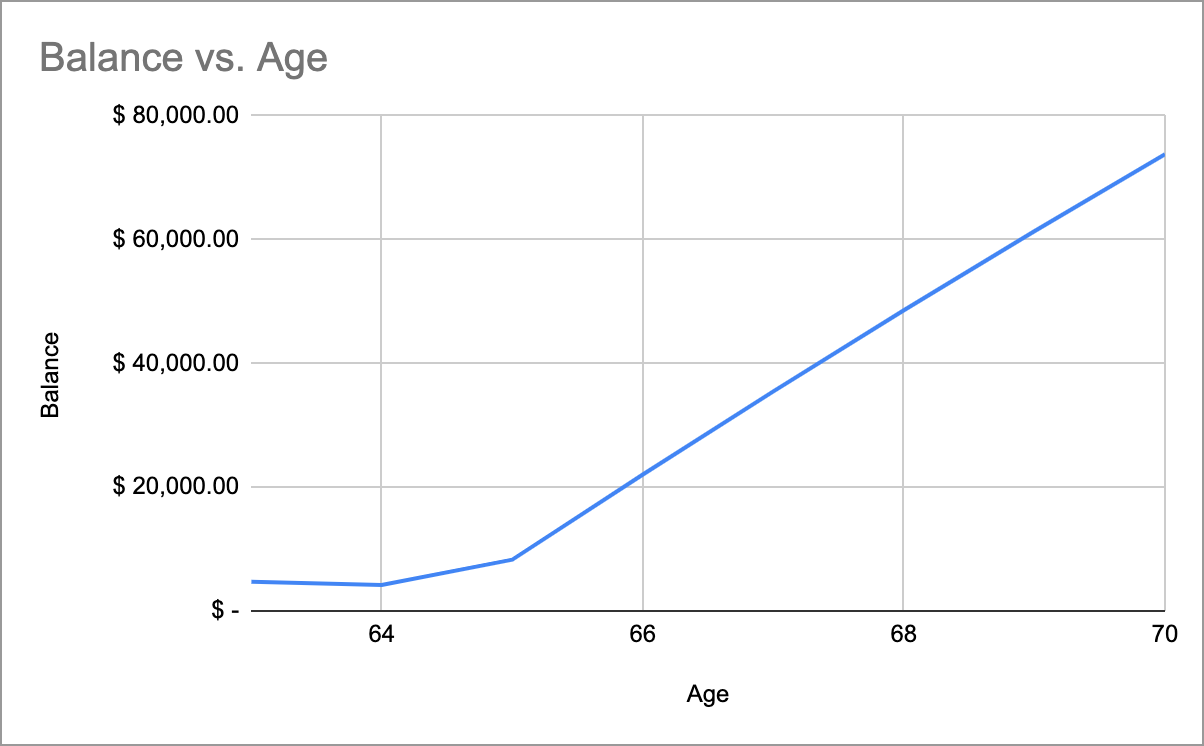
In this case, shrinking your expenses could help to mitigate that shortfall, buying you time, and allowing your retirement income (perhaps from a pension scheme) to catch up with expenses.
Building an accurate picture
To optimise your expenses, first we must go about building an accurate picture of it. Remember this one-liner from Part 1?

What we want to do is to break it down. An annual expenditure can be useful as a rough gauge, but when we break it down into a group of separate categories, it will give us a much more accurate picture of what the repeated expenses are going to look like, and more importantly, which of these expenses we can afford to cut down on to stretch our budget.
There are two general types of categories: Ongoing, and contributions to Buckets.
Ongoing expenses are those expenses that you can reasonably expect you will need to regularly spend on, and in relatively predictable amounts. Categories for this include things like breakfast, lunch, dinner, utilities, rent, transportation, medical checkups, etc.
Bucket expenses are more like a fund, or a stash. Think of them as a bunch of money you squirrel away every year for irregular expenses. For instance, when it comes to on-demand healthcare costs, it is unlikely that you know when you will fall ill. Instead of trying to predict this, it can be more reasonable to look at the healthcare costs you have incurred in the past, and set aside money in fixed amounts on a per monthly or per annum basis. In the case of healthcare this can act as a rainy day fund.
Other categories for buckets can include things like travel funds, furniture/renovation funds, vehicle maintenance funds, children’s college education funds, etc.
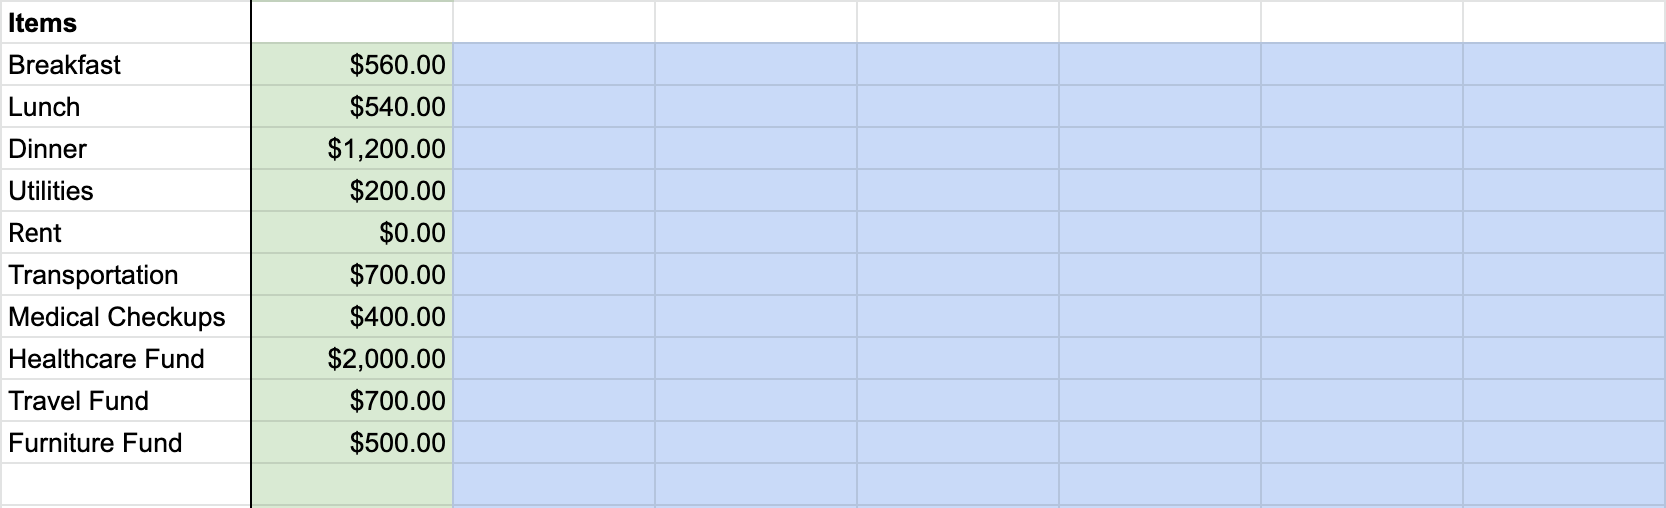
Based on your ongoing and bucket expense categories, you can generate a list like so in the spreadsheet:
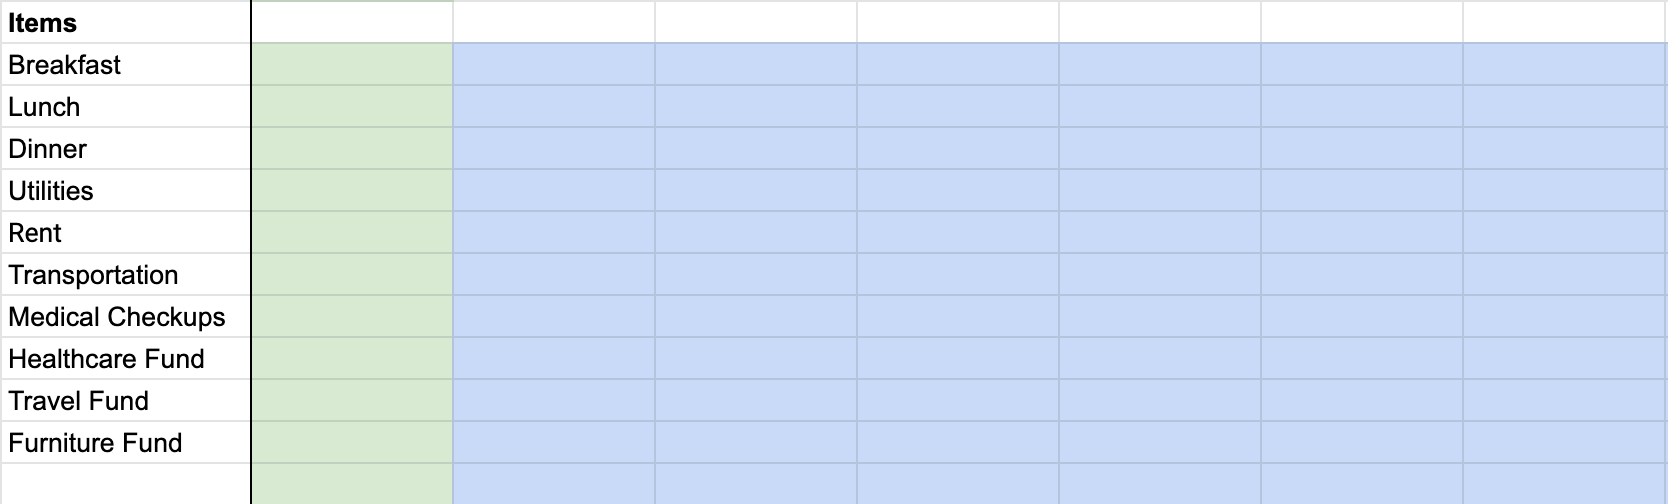
In the first column (in green), decide based on past evidence and future projections how much should go into each category on average every year. Once you have done this, you should end up with a spreadsheet that looks something like this:
Estimation is hard, and none of the above is easy to do with a completely 100% level of accuracy. But it is better to have a rough idea than to have no idea at all.
A Strategy for optimisation
With the list of categories, and their average annual amounts listed out, this is where some magic happens. For each of these line items,
- Decide if, for any particular year, you will be able to reduce that expenditure.
- Decide how much as a percentage of the original you can reduce that expenditure to for that particular year.
- Then put this into the relevant blue cell.
That’s all. The spreadsheet automatically updates the required fields, as if by magic.
Let’s run through a simple example. Let’s say that I decide to bite the bullet and not travel far for the next 3 years, from 2022 to 2024. I decide that instead of annual trips to Penang, I will just pop across the causeway to JB, and this cuts my travel expenses down to 20% of the original. What I do is put “20%” into the blue cells for Travel Fund from 2022 to 2024. Notice how Expenses drops by an amount equal to 80% of the original.
Note that for the sake of simplicity I have made inflation 0%, so it is easier to see that total expenses in 2024 is halved.
Of course, try not to mess with important survival-related expenses, like those that pertain to your healthcare or housing needs, unless you know what you are doing!
Conclusion
In this part we have looked at a simple method you can use to analyse and optimise your expenses – which can ideally help to bring forward your retirement, if only by a little bit.
If you are interested, you can check out the explanations of the original spreadsheet in Part 1.
For those interested in how to look more closely at your income stay with me and proceed on to Part 3: Optimising your Income.