
This post is part of a 3 part series that uses a spreadsheet to answer the following question: can you retire? The 3 parts are as follows:
Introduction
In this post I will walk you through how you can look at where you stand right now in your finances, and help you decide if (1) you will be able to retire right now, and if not (2) what you need to do to finally retire.
To do this, we are going to do what I call an experiment. An experiment with numbers. To do this experiment, we are going to have to use a spreadsheet.
To follow along, you can use the following spreadsheet:
Alternatively, download one of the prepared spreadsheets below:
Pay special attention to the cells that are marked out in green. These are the cells you will be adding values to. Everything else should populate on their own, so ignore them for now. Throughout this post I will explain to you what each of these parts consist of, and how you should go about finding the numbers to put into this spreadsheet.
Quick disclaimer: Please treat the information in this article as only one of the many sources you can use, and do your own further research in order to make an informed decision.
Defining the Problem
To start, we first need to understand some of the numbers we will be working with.
When looking at retirement, the question that needs to be answered is this: Do I have enough resources to maintain my present quality of life in the future?
There are 2 problems with this statement. The first is that resources represent many things, including the very basics for survival like food, water, shelter, energy.
In the past, people had to worry about each of these categories individually — and even today, some people – especially the most politically and economically disadvantaged in our world – still have to. But thankfully, the marvels of our modern monetary economy means that when planning for the future, many of us can distil each of these things into one single unit of measure: money.
The second is that the word future is very poorly defined, in the sense that it doesn’t specify clearly any kind of endpoint. A clearer way to define it would be to talk about it in terms of the remaining time we have left on earth to spend. In other much cruder terms – how long more til we die.
It might seem kind of harsh or even scary to bring death into the picture. But the unfortunate fact of the matter is, as long as we are living, we are spending money. My goal here is not to tackle the question of death, but rather the possibility that we might not have enough money to survive before death comes naturally to take us. In other words, we don’t want to be in a situation where we run out of money when we are still alive.
At this point, I want to take the original question, and more clearly define it as: Do I have enough money to maintain my present quality of life, for as long as I live?
Our Number 1 Priority
The above brings us all to our number 1 priority:
Our cash on hand should never drop below $0.
Never in any of our projections should the amount of money in the bank – usable, touchable, withdraw-able money – drop below zero. If this happens, we are in trouble.
All the calculations we will do are geared toward ensuring that this worst case scenario never happens in our projected future.
The 4 Questions
With this new question, things become simpler to look at, because we can break this question up into 4 smaller ones:
- How long more do I have to live?
- How much money do I have now?
- How much money do I expect to go out in the future?
- How much money do I expect to see come in in the future?
We will answer these questions in the following sections, and in doing so, build up a spreadsheet that will help us decide if retirement is an option.
How long more do I have to live?
In general we can’t really choose how long we want to live. But in trying to avoid a situation where we run out of money while still living, we can make some estimations by using averages and safety buffers.
Start by looking at the life expectancy of the country that you live in, and choose the segment you fit in. Usually this is divided into Male and Female. Take the average of that, and add a safety buffer.
Personally, I live in Singapore and am male. So I use Singapore’s average life expectancy for men, which is about 82 years. I build in roughly a 20 year buffer, and use 100 years of age as the upper cap.
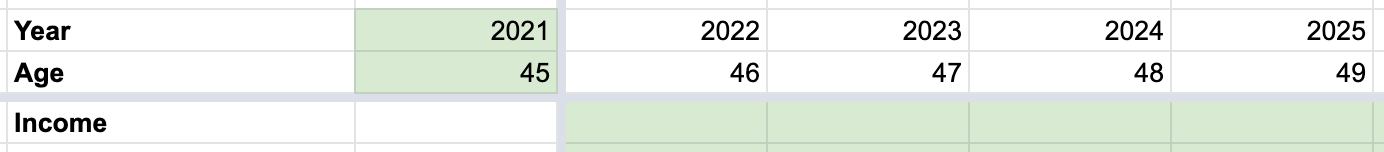
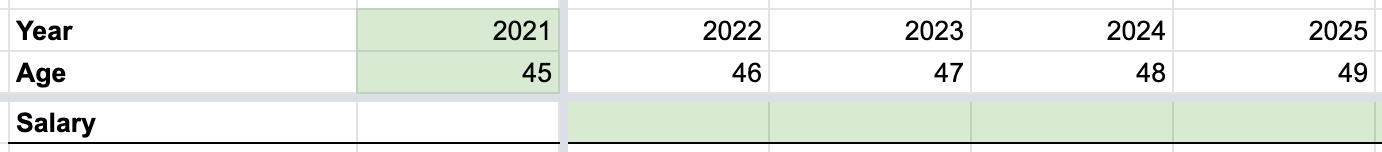
To reflect this in the spreadsheet, first we input the current year (2021 at the time of writing this post), and your current age (I use 45 for illustration purposes).

Then go ahead and delete all the other columns that come after your own personal life expectancy. In my case, that would be 100.
How much money do I have now?
This basically represents how much money you have in your bank account. The total amount in savings you can tap on today. Simple as that.
Got some cash lying around as well in a piggybank. First make sure that belongs to you (duh!), and if so go ahead and put that in.
Be sure to not include money that you have earmarked for future use — for instance if you have set aside a sum of money for your children’s education, or as a rainy day fund, leave it out. When planning for retirement we want to be as safe as possible, having some money set aside as a rainy day fund helps us be sure that even if things don’t go as planned, we have something to back us up.
To reflect this in the spreadsheet, put the total savings you have discovered into the savings cell.

How much money do I expect to go out in the future?
In other words, your expenses. More precisely, we want to look at how much you expect to be spending every year for the rest of your life. On a year-by-year basis. But how do we estimate this?
Remember the earlier question:
Do I have enough money to maintain my present quality of life, for as long as I shall live?
The key phrase here is “present quality of life”. If maintaining our present quality of life is the goal, then our current annual expenses is a good place to start.
Current Annual Expenses
For those who do keep track of your expenses, look at how much you spent over the past few years, and decide what expenses you will likely have to continue to incur on an annual basis.
For those who do not, things are a little more vague, but it might be useful to take the past few years (5 maybe?) of monetary outflows from your personal bank accounts, and average them over the years to form an annual baseline.
This gives you an estimate of how much money you probably need on an annual basis.
To reflect this in the spreadsheet, put the total expenses you have discovered into the expenses cell.

Inflation
But your past expenses are only part of the equation. You also have to factor in inflation into your expense calculation.
Inflation is an economic concept that basically means that prices of goods and services are going up all the time. Given the way our current economy is structured, inflation is usually a given, and generally what governments do is attempt to control this level of inflation.
What this means for us is that we must factor this increase in our expenses as the years go by, on an annual basis. In the spreadsheet, I do this by setting an annual inflation rate of 2% (to me this provides a relatively conservative baseline).
Increase this number if you want to be even more conservative, or decrease it if you think I’m being too cautious.
To reflect the inflation rate in your spreadsheet, change the inflation cell to any value you think appropriate. The relevant calculations to adjust your future expenses have already been made in the spreadsheet. If you want to do this yourself, just remember that the inflation rate compounds rather than accumulates over the years.

At this point when you look at the balance amount, especially towards the end of the spreadsheet, you might be looking at a pretty scary number. A large part of this will be because of the effects of compounding inflation, which causes expenses to balloon in dollar value over the long-run. I know for a fact that my mum was shocked when she first how the expenses accumulated.
But hang in there, because we still have more numbers to run. And these ones might help to make that scary looking number much tamer.
How much money do I expect to come in in the future?
Here we look at our sources of income, on a year-by-year basis, for the rest of our life. This includes salary, returns from investments and pension funds, income from government pension schemes (like CPF life in Singapore), etc.
Non-salary Income
If you have investments in bonds, look at when the payouts are coming in, and when the bond comes due.
If you have investments in stocks, make a decision on whether you want to include these in the calculations. There are a few ways you can approach this:
- Exclude these, because the volatility that comes with stocks means that relying on these numbers for retirement (which requires a certain degree of stability) can be problematic.
- Decide on which ones you want to convert to safer investments, and include only those.
- Take the riskier route, and include all your stocks. Would not be my personal choice.
Include government pension schemes here, like CPF (for those of us who live in Singapore).
Unlike expenses and savings, we don’t want a single number for this section. Instead, we want to know how much you will receive each year, year-by-year. This is because the income you will receive this year might be different from the income you will receive next year, depending on when your investments start seeing returns, when your pensions start disbursing funds, etc.
To reflect non-salary income in your spreadsheet, enter the income you expect to receive year-by-year in the income cells, handling each year individually.
Salary
Salary is a little trickier. The reason I say this is because retirement essentially means that we want to stop working – which means we no longer will be drawing a salary.
I would say exclude salary for now. But if necessary, you can include your salary if you want to see how much that affects your cash balances over the course of your future. Maybe working a few extra years can turn a negative balance into a positive one?
We cover more about how to use your salary numbers to optimise your income in a later post.
If you choose to reflect salary income in your spreadsheet, enter the salary you expect to receive year-by-year in the salary cells, handling each year individually.
What do we do with the answers to these 4 questions?
After these 4 questions have been answered and the numbers populated in the spreadsheet, we turn our attention to the balance we see year on year.

This balance essentially tells us how much we will have left at the end of every year.
If all the numbers are positive, congratulations! Maybe it will be possible to retire after all. Have a discussion with your loved ones, sleep on it, think about it. And rest better realising that the option to retire was not as elusive as you had originally thought.
If some of the numbers are negative however, then we have a problem – because this essentially means that there are some years where we are projected to make a shortfall.
Fortunately, there is still hope.
The numbers you have just produced can now be used to give you a better idea of what you need to do to get closer to retirement. There are many approaches that are still available to you, for instance saving more, cutting out some superfluous expenses, or even looking at some investments.
I explore some of these strategies in the later parts to this series, starting with Part 2: Optimising your Expenses.